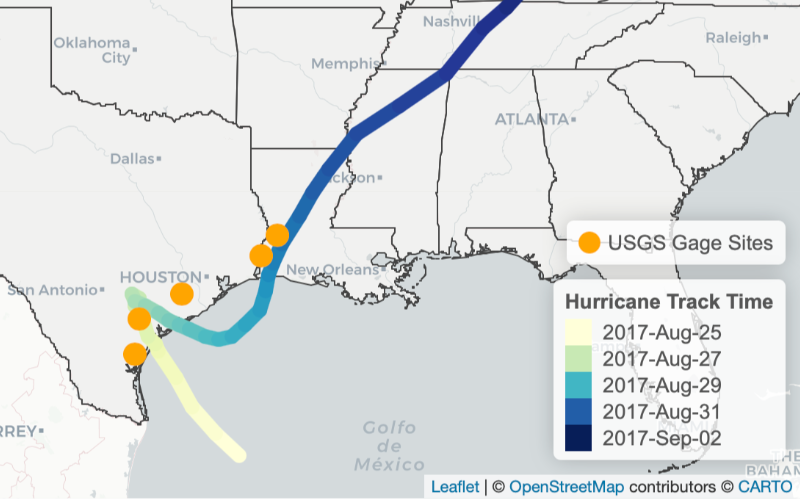
Using a robust data pipelining tool in R to build a reproducible hurricane data visualization with multi-agency water data
![]()


How to run
Running on Binder
The notebook is designed to be launched from Binder.
Click the Launch Binder button at the top level of the repository
Running locally
You may also download the notebook from GitHub to run it locally:
Open your terminal
Check your conda install with
conda --version. If you don’t have conda, install it by following these instructions (see here)Clone the repository
git clone https://github.com/eds-book/2dd74dfa-d87d-442f-bea1-a19c8953f66e.gitMove into the cloned repository
cd 2dd74dfa-d87d-442f-bea1-a19c8953f66eCreate and activate your environment from the
environment.ymlfileconda env create -f environment.yml conda activate 2dd74dfa-d87d-442f-bea1-a19c8953f66e R --quiet -f install_local.RLaunch the jupyter interface of your preference, notebook,
jupyter notebookor labjupyter lab
- Bogan, A., & Platt, L. (2025). Using a robust data pipelining tool in R to build a reproducible hurricane data visualization with multi-agency water data (Jupyter Notebook) published in the Environmental Data Science book. Zenodo. 10.5281/ZENODO.17808328